
Alice and I form the digital accessibility unit at York. Disability Services often refer students to us for additional digital skills support. We also offer support to the lecturers who are working with these students, some of whom have severe visual impairment. We had a discussion about our experience so far this academic year on creating tactile resources for students. Although we both work in the digital field, there are things that are easier to understand through other means, and tactile resources can provide a good supplement for visuals and technical content. In part 1, Lilian explains her process of thinking through when and how to make tactile STEM graphics for a student. Equipment mentioned is explained in the heading ‘What tools do you need to make tactile graphics?’.
How do you decide when to make tactile graphics and who will make it?
If a lecturer asks me to help make tactile graphics, my first question would be to ask ‘how many’ and ‘how disposable are the graphics’? By this, I mean how much time does the student need to spend with the material to understand the visual concept. If there are 20 graphs and they are not too complex, asking the lecturer to have an appointment with the student and drawing them on a tactipad and plastic film (also known as German film) is often a good approach. You can build up the diagram bit by bit, which is easier for the student to understand than supplying a finished product. The student or the lecturer can then use a braille labeller to label the diagram.
It’s worth using a marker to label the diagram as well so a sighted support person can help identify what the labels are in future.
We’ve had challenges with the sticky braille labels falling off the plastic film so we would recommend using double-sided tape to tape them down. (Update 9 May 2025: I would aim to stick labels on paper rather than the plastic film if you want them to stick around! See part 3.)
If the resource needs to be handled for a bit longer, and has complexity, then I would get involved in making the resource for the student.
How can the student’s peers get involved?
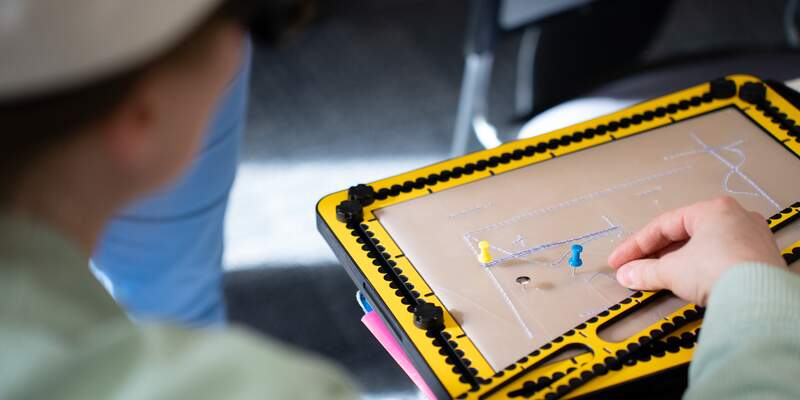
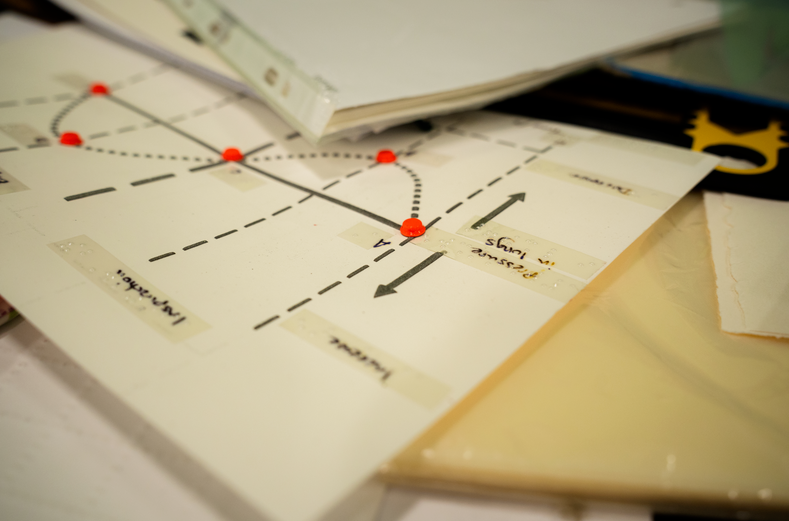
A quick way to convey simple graphs that don’t need to be stored is to use a pinboard (or even the tactipad) with pins and string. This might be good for a quick scatter plot explanation, or even how a gradient changes if something in an equation changes. This is a good way for the student’s peers to get involved in collaboratively producing something tactile as an immediate resource for discussions. It helps them to understand how to work inclusively but also provides a physical way for the group to work together with data.
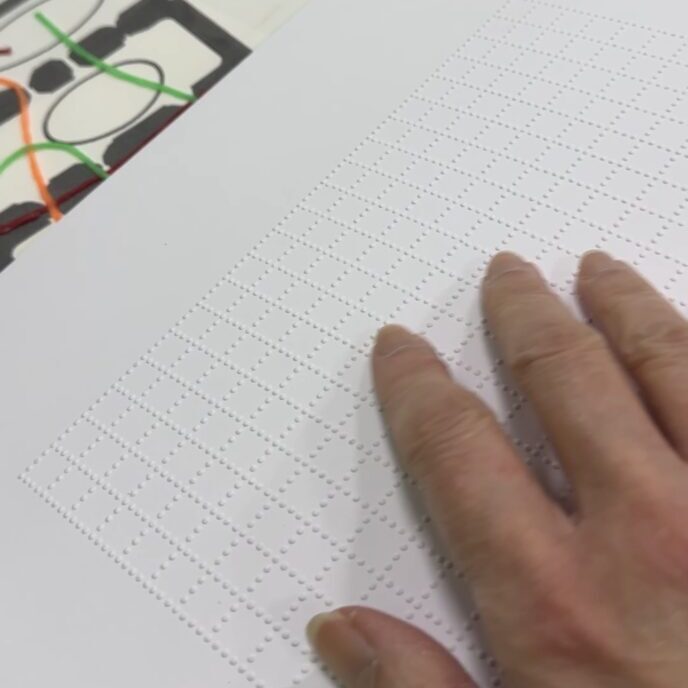
Braille graph paper, available from the RNIB shop, could be useful for this kind of work.
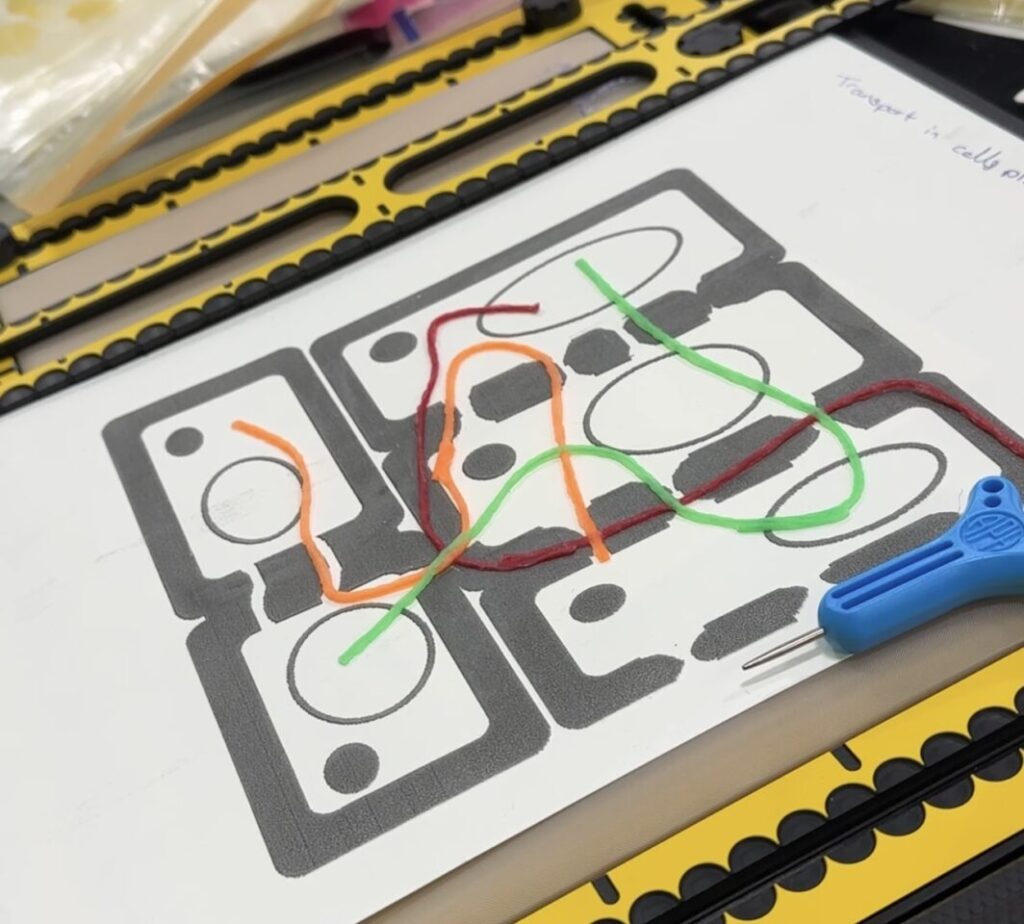
Other items that can prove useful are Wikki Stix, a kind of waxy string that sticks to paper, allowing you to create fluid shapes that will stay in place. This could be used in conjunction with previously prepared tactile backgrounds. In the image below, a cell diagram was prepared by the student’s teaching assistant (during A levels) using Swell paper with Wikki Stix added on top of the cell diagram.
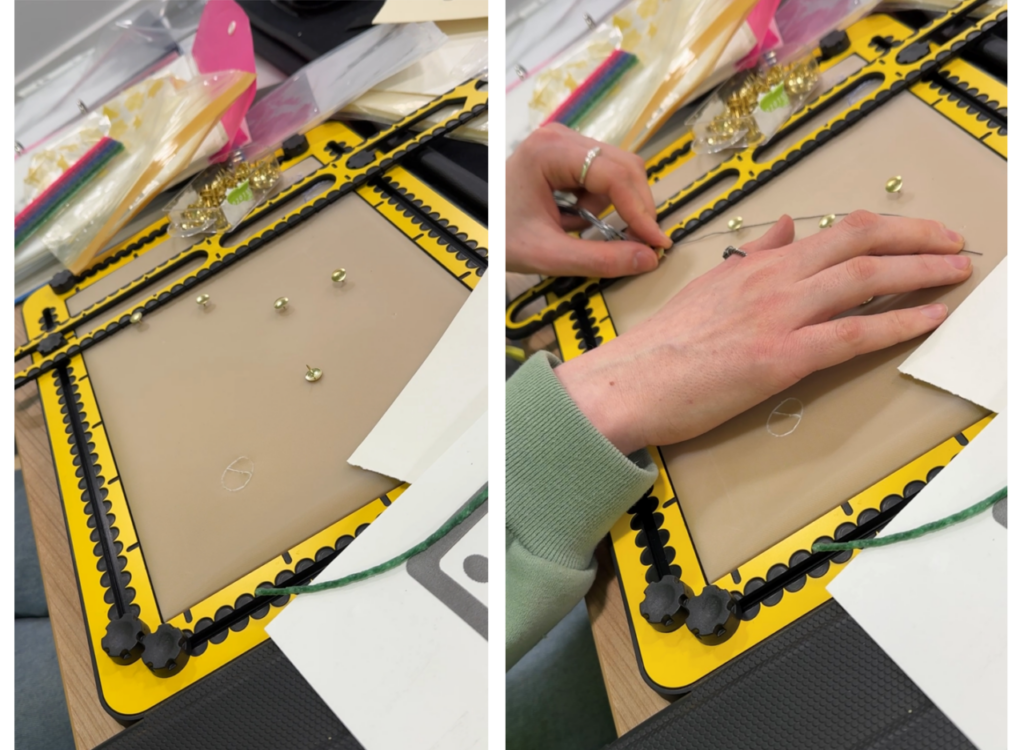
Florist wire and pins on the TactiPad can also be used to good effect, as demonstrated by a student in the image below.
When would a lecturer make tactile resources with a student and when would they do it in advance?
When a diagram can be drawn easily on a TactiPad, but would end up being too complex once it’s completed, it’s worth building up the diagram with the student in a face to face tutorial, drawing up one bit at a time.
Some figures are straightforward enough for the lecturer to prepare in advance. We advise departments to purchase a geometry mat (a cheap version of a TactiPad) and some plastic film so they can create their graphs easily. Below is a graph that shows the trade off between soil and plant carbon storage. It’s been prepared by the lecturer in advance to use in a session with students so a helper can pull out the graph which is labelled, and put it in front of the student. Adding the labels in handwriting is a necessity for sighted helpers or peers to use this with a student.
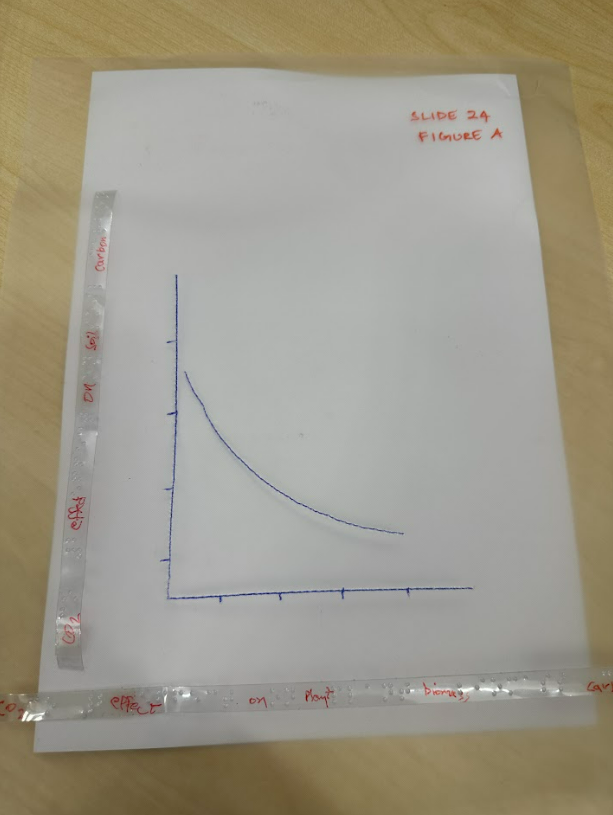
This can be seen as a ‘disposable’ graphic since once the concept has been illustrated in class, the student should be able to understand the concept without a tactile aid. The student is unlikely to want to work through piles of graphs like this on their own, but if they do wish to keep them, I would notch the top right corner of the graph (cut away the corner) to help them work out which way is up, add the week number, slide number and figure number and possibly a bit of context. This can be a lot of work if you have several graphs. Plastic film can be lightweight but a pile of these with labels would soon become too bulky and unwieldy to store.
You’ll also note that the labels are curling up and wanting to peel away from the plastic film. This is a constant battle with braille labels made with a braille labeller. The easiest thing to do is to add a bit of double-sided tape to ensure the labels stay put. I’ve seen advice from other VI instructors to try using Dymo tape instead in the labeller. (See updated advice on this in Part 3.)
What’s the thought process in making one of the more complex resources?
Box plot example
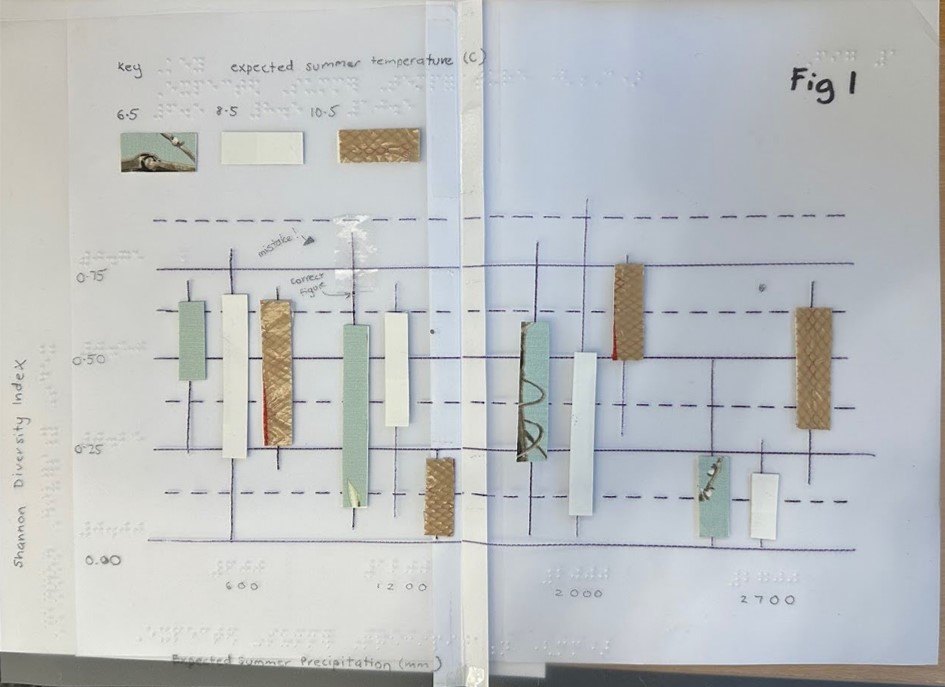
One example is the box plot I made for a student’s Bioscience module recently. It took me multiple attempts and several hours! Fig A is the digital image and Fig B is the tactile resource I made.
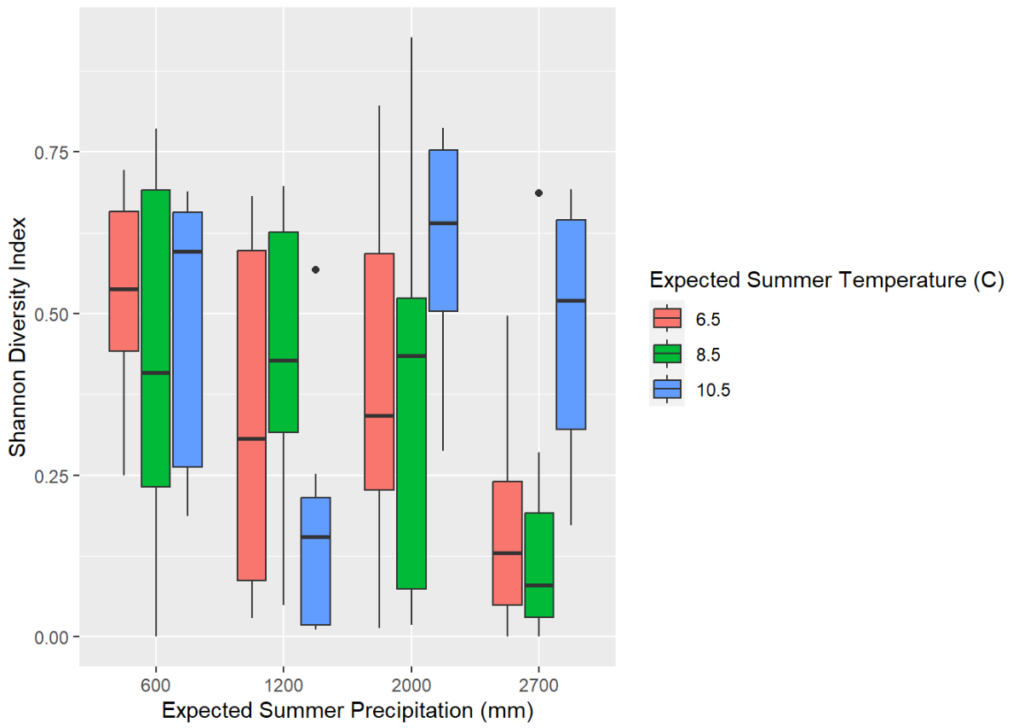
The box plot was sent to me as a digital image so I had to create it on graph paper first. I quickly worked out that A4 landscape would be too small to fit in all the detail and the braille labels so I decide to make it an A3 size. The challenge is trying to stick 2 sheets of plastic together! You’ll see a big paper seam in the middle of the box plot. This allows the resource to be folded so that’s a benefit, but the plastic film would not stay stuck to any kind of clear tape. In the end, I had to use double-sided tape and a paper seam to keep the thing together. I’ve since found some A3 laminating pouches that I think will work in a similar way to the plastic film so I’ll give that a go.
Drafting what you need on graph paper can be helpful as you have to remember braille takes more space. I made sure there was space for a key as well at the top of the graph.
Next, I had to work out how best to convey the grid lines in such a way that they wouldn’t create too much cognitive load. I used solid lines at 0.00, 0.25, 0.50 and 0.75, with dotted lines in between to indicate intermediate values. I decided to braille the labels directly on to the plastic film rather than using the braille labeller since the labels tend to fall off. After making a couple of mistakes and having to start over again, I recommend brailling any text or labels onto a separate sheet of plastic film, cutting them out and using double-sided tape to stick them down. That way you can adjust where the label is going to go as brailling directly on to a diagram is hard to correct if there are any spacing adjustments you want to make.
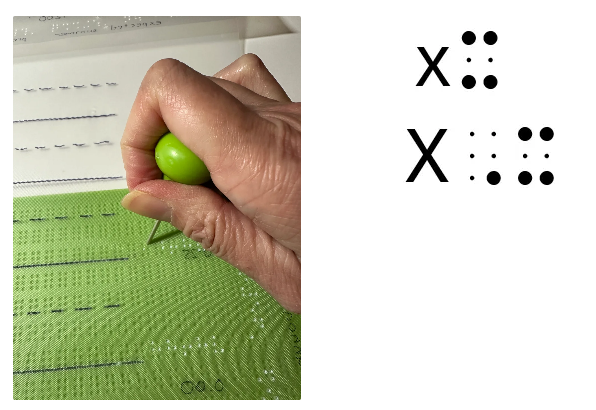
Fig C shows me using a manual braille slate to press the braille dots into the plastic film. It also shows the difference between lower case x and upper case X in braille. Manual braille takes a bit of getting used to; you have to press the dots into the film back to front so they are the right way around when you feel them. There is a level of cognitive load in flipping the characters you are brailling. I type what I need to braille into Brailleblaster on my laptop so I have a reference to work with, and can work out how many characters I might need. Capital letters and numbers need two cells, for instance, so it’s not as straightforward as just counting the characters of the text.
The nature of this box plot meant I had to find 3 different textures to indicate the different temperatures which are visually conveyed in colour. I had to ensure it was something that had a fairly firm edge to help with perceiving the upper quartiles and lower quartiles. I used some plain card, some leftover wallpaper that had a texture and stuck some mesh bag on to card for the third option. Each whisker was drawn directly onto the diagram but the upper and lower extremes were indicated with a braille dot to make it more perceivable. I left out the median line at this point because I felt it would be easy enough to score them in when the lecturer was explaining the box plot to the student. Starting with a simpler version is always best. In this case, I couldn’t easily replicate the resource multiple times and build it up in complexity because it would take too long! Outliers were simply indicated with a big dot.
I made a mistake on a whisker in the box plot and rather than make the resource all over again, I covered the mistake with clear tape and indicated the mistake in text for anyone using the resource with the student. The correct placement of the dot at the top of the whisker should help to indicate the correct upper extreme.
Labelling
Students have said to me that it’s hard to work out which ‘graphic’ is being referred to in the text of their lecture notes. Luckily this lecture series has 3 key figures and the lecturer said they would clearly state which figure they were referring to. Ideally, the graphic should also be labelled with the module and week number, but this labelling could be done to the pocket sleeve that holds the graphic rather than being on the graphic directly.
Scatter plot example
Another example is the scatter plot.
Fig D shows the digital version and Fig E shows a close up of the tactile version.
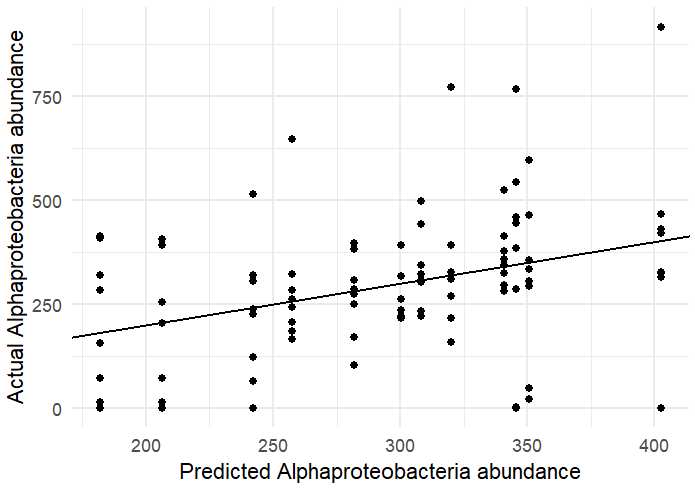
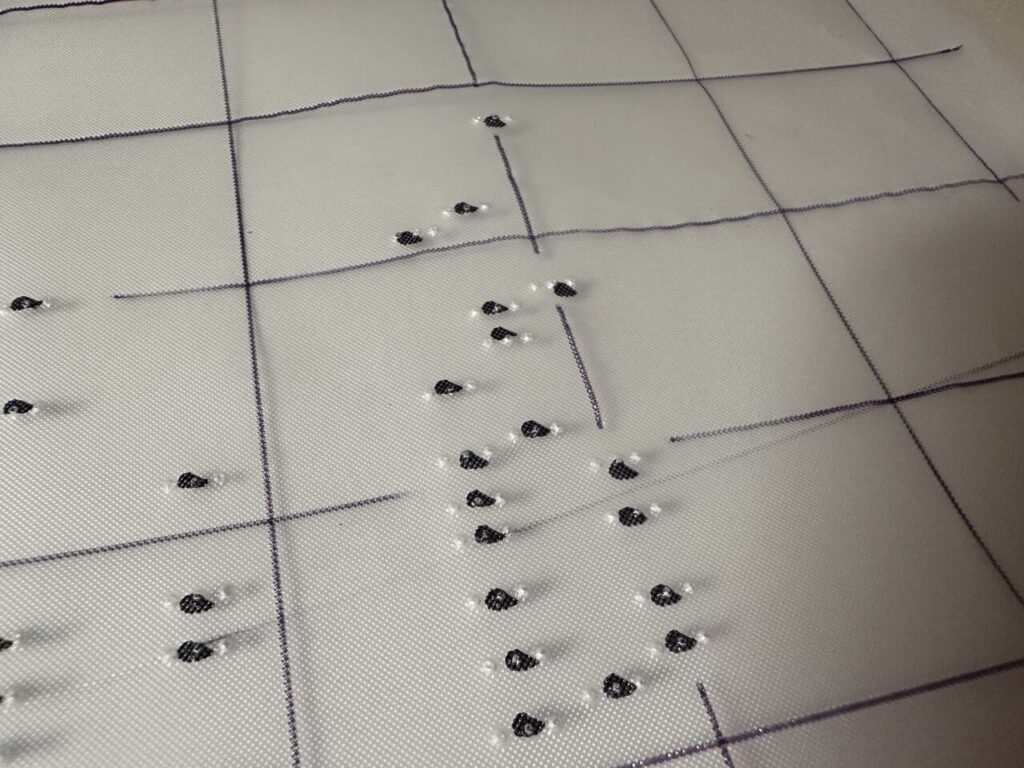
I had to figure out how best to convey the data points. I took the idea of using 3 dots to indicate a data point from the PathsToLiteracy.org site about creating tactile tally charts. This meant it was easier to sense how far apart each point was on the y-axis. I decided to leave out the regression line and again, suggest to the lecturer that the student score this in with their help after exploring the scatter plot. The regression line was indicated in pen for the sighted helper.
I had the dilemma of how to make data points perceivable if they were on the grid lines. 3 dots on a solid line is not easy to tell apart so I decided not to score the grid line near the data points.
I had to make the scatter plot A3 in size, but I feel an A4 version may be helpful to give the student the overall impression in a more meaningful way while the A3 version allows more detail of where the data points bunch up and how many there are.
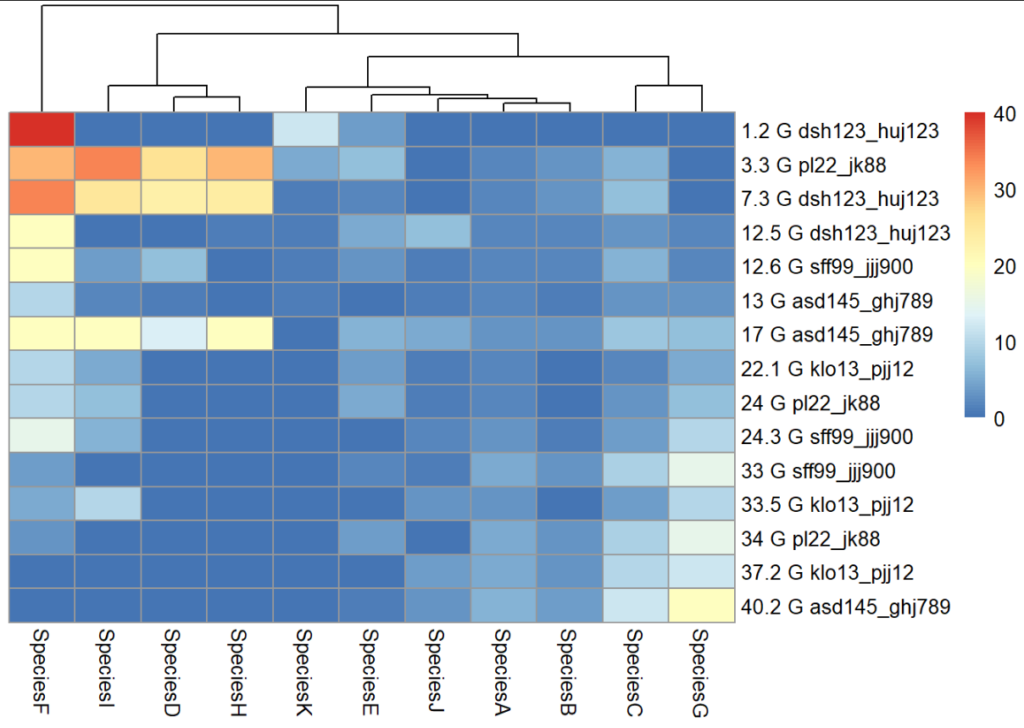
Heatmap
Fig F shows a heatmap that the students need to use in the workshops. We discussed printing this on Swell paper, but this is unlikely to produce enough definition to easily perceive the different values in the matrix. I haven’t yet created this resource but plan to use 1 dot for dark blue, 2 dots for mid-blue etc. With a key supplied, this should be a good way to make the matrix perceivable.
What tools do you need to make tactile graphics?
You can make tactile graphics out of anything and it’s worth being creative with various textures and materials. However, there are some standard tools available to support the making of tactile graphics.
- TactiPad – The TactiPad has a rubbery surface. When some plastic film is placed on top of it and a line is scored, the line can be easily traced with fingers. The line is a ‘positive’ rather than a ‘negative’ impression, in other words, scoring the film on a tactipad creates a raised line. This makes creating graphics simple since you can simply draw as you would on paper without having to do things in reverse. Our student had a TactiPad from doing her A levels and brings this along to tutorials and group work so tutors and peers can make graphics easily with her. The TactiPad is a slightly bulky tool but worth the effort to aid communication. I purchased two different versions for my own use: Sensational Blackboard from the US and the geometry mat from RNIB. My favourite is the Sensational Blackboard as it is flatter and has a rigid base. The geometry mat we fondly call ‘fake skin’ and we lend this out to lecturers who are preparing materials in advance. I’ve tried to score on a basic rubber mat but found that it doesn’t create raised lines. There’s some property of the material in the geometry mat or TactiPad that makes the plastic film score ‘up’ rather than ‘down’.
- German film – also known as plastic film or embossing film, they come in A5, A4 and a size that fits the tactipad (27 x 34 cm). You can emboss on thick paper, but it’s likely that the paper will flatten as the lines are traced whereas with plastic film, the lines stay raised on the plastic. Paper is also more likely to tear when being scored, compared to plastic.
- Braille Slate – These are easily available from online stores on the Internet and come in all shapes and sizes, from small notetaking slates to A4 slates. They allow you to create braille but in reverse. UEBOnline is a good website to use if you are going to learn braille. There are many YouTube videos and websites that will explain the braille code. The main thing to know is that we use UEB (Unified English Braille) and for maths, we use UEB maths. In the USA, they use nemeth code for maths.
- Braille labeller – Available from the RNIB store, these are like Dymo labellers and allow you to press braille into a sticky label to use with diagrams. Unfortunately, the labels don’t seem to want to stick to the plastic film so double-sided tape is advised! I also find it easier to just manual braille the longer labels onto film, cut that out and stick it on rather than using the braille labeller, but it’s a handy tool for anyone who doesn’t want to learn braille. You are limited to uncontracted braille which can make for longer labels. Learn about uncontracted versus contracted braille.
- Perkins brailler – A Perkins brailler is like a manual typewriter that will make embossing much quicker on paper or on film. However, you would need to learn to type in six-dots, which is the standard input method for braille code.
- Brailleblaster – This free software runs on your laptop and allows you to type in text and maths and see the braille code that you can then produce for your diagrams. It’s possible to print braille – see the section on Printers below.
- Pin board, string and pins – A large pin board with string and pins can be a useful temporary surface for sketching out quick concepts like graphs, gradients and scatter plots.
- Wikki stix – These are slightly tacky (to the touch) bits of wire that will stick to each other or to paper and plastic, like blu-tack would do.
- Penfriend – This is an audio-labeller. You stick a penfriend label on a diagram and you can record a description of it to play back later. Some students may have this which can help you create resources together.
Aren’t there printers that can make these tactile graphics?
There are machines that can help in making tactile graphics.
PIAF tactile image printer or Zychem’s Swell Form Tactile Graphics machine are two such machines. They have to be used with Swell paper which has a special coating. After printing a graphic onto Swell paper, you put it through the machine which causes the areas with black ink to ‘swell’ up. There are lots of tricks needed to make good graphics with swell paper which my colleague, Alice will write about in part 2. We use a combination of manually created diagrams and those generated with a Swell machine depending on what works best.
Braille embossers – These machines emboss raised dots onto braille paper and are therefore useful for creating braille text as well as diagrams. Not all braille embossers can do diagrams, and not all of them can generate different height dots. Some will print out in coloured ink as well as embossing dots like the SpotDot embosser. These are very expensive but it’s on our wish list!
Aren’t there braille pin boards that can dynamically create diagrams?
You would think so, wouldn’t you? These items are only just coming to the market in 2025. One example is the Humanware Monarch. Other examples are mentioned in my previous blog post on the Braille in Focus event under Braille Technology.
What about shapes that are 3d in nature?
My colleague, Alice, will discuss how we’ve created some 3d objects using clay and 3d printers to supplement student learning in the next blog post. We also show how a student has used voice labels to help with remembering anatomical structures on a skull!
Conclusion
Tactile resources can be quick and easy to make or be time consuming or expensive and reliant on having the right equipment. Several lecturers have now learned to generate quick tactile graphs to support their students and for that, we are very grateful. The minimum tool set has to be the geometry mat (at £13.50) and some plastic film. I would advise anyone starting out to speak to their Disability Services to coordinate the purchase of these resources to ensure they can be used across several departments if necessary.
We would welcome any advice from others who have made tactile graphics for their higher education students as we have so much more to learn. Please either leave us feedback below or get in touch: digacc-support@york.ac.uk.
Acknowledgements
Many thanks to Dr Robert Barham, Lecturer in Mathematics at the University of Leeds for reviewing my initial blog post draft and making suggestions for changes. Robert is also supporting a VI student at Leeds and together we are building knowledge in this area. We hope to showcase more of his input as we continue to explore this topic in ensuing parts.
Many thanks to the lecturers who have given permission for their diagrams to be used in this blog post. We are very grateful for their hard work in supplying these for the blog post and for aiming to make their content usable by their sight-impaired students.
Many thanks to Alex Holland, our photographer, for many of the photos at our workshops, and our students who provided examples for us to capture.
Useful reading
Hinton, R. (1996). Tactile Graphics. Edinburgh, Scotland: Scottish Sensory Centre. [Online]. Available at: https://www.ssc.education.ed.ac.uk/resources/vi&multi/Hinton/hinton.pdf.
McCormack, G. (2014). Creating Large Print and Tactile Graphs. [Online]. Paths to Literacy. Available at: https://www.pathstoliteracy.org/creating-large-print-and-tactile-graphs/ [Accessed 28 February 2025].
Tactile Graphics: A How To Guide. [Online]. Available at: https://www.tactilegraphics.org/index.html [Accessed 28 January 2025].
(2015). The Use of Wikki Stix Within the Classroom. [Online]. Perkins School for the Blind. Available at: https://www.perkins.org/resource/use-wikki-stix-within-classroom/ [Accessed 28 February 2025].
Related posts
Creating Tactile Graphics for VI students – part 2
Creating Tactile Graphics for VI students – part 3
Reflections on our Supporting visually impaired students workshop.
4 thoughts on “Creating tactile graphics for VI students – part 1”